 Vox Stella
This 60-day mundane astrology conflict forecast tests whether Vox Stella can identify specific dates before events happen. Astrological forecasts are easy to reshape after the fact: a date can be selected, a chart changed, or a dramatic transit emphasized once the outcome is known. This experiment instead records the method, dates, misses and false alarms in advance so the result can be judged without rewriting the rules.
For readers asking when another Iran–Israel–U.S. escalation is expected, whether a wider war is anticipated, or what happens next, this article provides dates without presenting them as certainties. It is a prospective Iran war astrology experiment for 2026: six forecast periods were recorded before the outcome, and every one will remain visible until the 60-day test is scored.
When might the Iran–Israel–U.S. war escalate? Forecast dates at a glance
The experiment records August 11, 2026 as its strongest U.S.-chart forecast date. Its overall combined score is 37.09. Five stronger combined-score periods appear in September:
- September 6–7: 77.17
- September 12–13: 92.67
- September 15–16: 83.99
- September 18–19: 85.02
- September 21–22: 73.66
These scores rank dates inside this one 60-day scan; they are not probabilities that a conflict will occur. The dates were generated before the observation period and will remain visible whether they become hits, near hits, misses or false alarms.
On August 2, 2026, Vox Stella froze the forecast for a possible renewed direct conflict involving at least two of Iran, Israel, and the United States. The engine evaluated 121 timestamps and keeps the method fixed while the observation period unfolds.
Important: this is a prospective astrological timing forecast and engine experiment, not a calibrated geopolitical probability, intelligence assessment, or safety tool. The inputs, dates, rules, and evaluation standard are fixed in advance so the result can later be judged honestly.
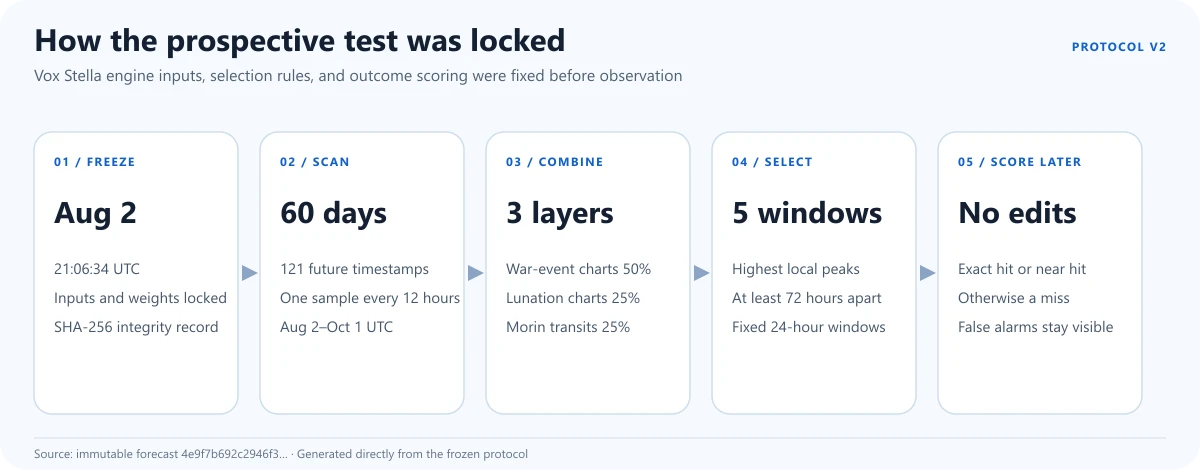
What made this a prospective experiment?
The forecast file was generated at 21:06:34 UTC on August 2. Its first sampled timestamp was 21:15 UTC, 505 seconds later. That short but positive lead matters: the test began in the future rather than quietly including an already-known timestamp.
The plan then remained fixed across a 60-day interval ending October 1 UTC (October 2 in Israel local time). It used a 12-hour grid, producing 121 equally spaced samples. The combined score selected five high points, kept them at least 72 hours apart, and placed a fixed 24-hour window around each one. August 11 was recorded separately because it was the strongest U.S.-chart-only Morin signal.
The qualifying outcome was also defined before the test: the first independently verifiable new direct kinetic interstate action after the freeze involving at least two of Iran, Israel, and the United States. Proxy-only action, rhetoric, sanctions, military exercises, or new reporting about an earlier event would not qualify.
Which Vox Stella features powered the mundane astrology forecast?
The run used the same calculation engines found in Astro Clock. A fixed research script repeated the same steps for every time in the test, instead of letting a person browse charts and choose the most attractive contacts.
- Astro Clock → Mundane Analysis: set the type of chart, country, place, date, and conflict question, then showed which rules were active and why each chart received its score.
- War Event + War Outbreak: ran the Mundane Analysis
war_eventchart type with thewar_outbreakdomain for three views—Israel toward Tehran, Iran toward Jerusalem, and the United States toward Tehran. - Lunation + Campaign Escalation: ran the
lunationchart type with thecampaign_escalationdomain for Tehran and Jerusalem at the same 121 timestamps. - Astro Clock → Transits, Morin mode: checked the saved national charts for Mars and Saturn contacts, including how close each contact was, whether it was becoming exact or moving away, and which house it affected.
- Registered national charts: used the Israel Proclamation 1948 chart and the contested U.S. Watters 1776 chart. Iran was left without a national-chart transit layer because Vox Stella currently has no registered Iranian national chart.
- Timeline and date selection: placed the three sets of results on one comparable 0–100 scale, drew all 121 points, and selected five high points that were at least 72 hours apart.
What came from the app: Vox Stella supplied the Mundane Analysis and Morin Transit calculations. The 60-day comparison, weights, saved date windows, and later scoring rules were designed for this experiment. The normal app does not claim to calculate a percentage chance of war.
How an AI assistant can use Vox Stella MCP
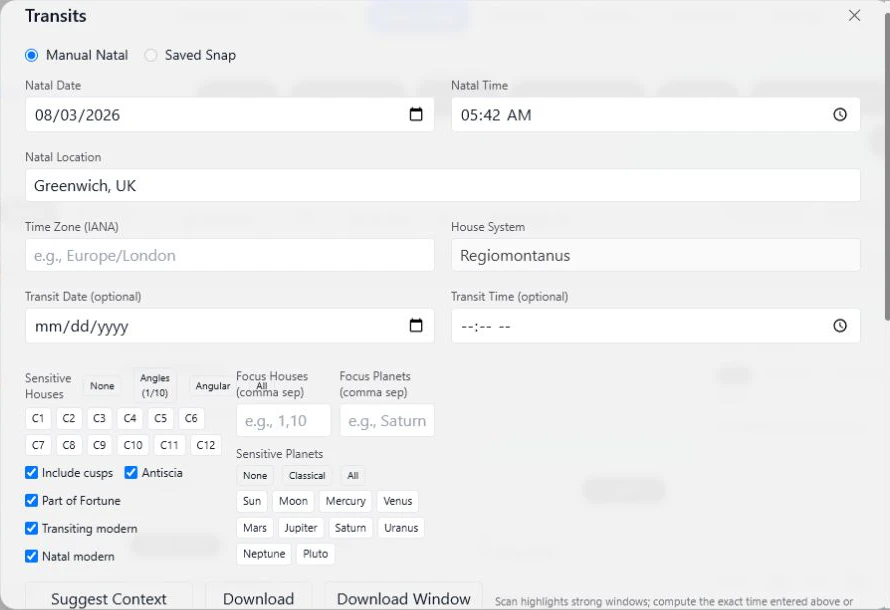
Vox Stella includes Model Context Protocol (MCP), a connection that lets an AI assistant ask the app to perform calculations. After Vox Stella is activated on a Windows computer, the assistant can send the necessary dates, times, places, chart settings, and search range, then explain the results returned by the app.
The connection supports Synastry, Trait Profile, Transits, Astrocartography, Election, Chinese Astrology, Forensic, and Certification, as well as chart calculations, current positions, and planetary hours. For Transits, an assistant can check one moment or search a date range for stronger periods. Vox Stella does the astrology calculations; the assistant helps enter the question and make the output easier to understand.
The connection works on the user's own computer and is limited to calculations. It cannot browse private saved charts or notes, change app data, or reveal account details. Setup is available in Vox Stella's Settings page. The 60-day conflict test in this article still required its own research plan: the AI connection does not turn a political question into a one-click war forecast.
How the mundane astrology conflict-timing method works
The experiment combines three different timing layers. Each layer is converted into a percentile rank within the same 60-day observation window before the weighted ensemble is calculated.
1. War-event pressure: 50%
The largest share comes from three event-chart views: an Israel-facing chart calculated for Tehran, an Iran-facing chart calculated for Jerusalem, and a U.S.-facing chart calculated for Tehran. These views look for the chosen war-outbreak rules, including Mars close to an angle, the aggressor's ruler close to an angle, open polarity, and related event-chart signals.
2. Lunation and campaign pressure: 25%
The second layer uses lunation charts for Tehran and Jerusalem. It evaluates campaign-escalation rules on the same timestamps, allowing lunar-cycle and malefic-angularity signals to contribute without dominating the result.
3. Morin national-chart transits: 25%
The final layer applies a narrow Morin-style filter to the saved Israel and U.S. national charts. It accepts only Mars or Saturn in conjunction, square, or opposition to sensitive chart points connected with houses 1, 7, 8, or 10. The score rises when a contact is closer, nearly exact, still moving toward exactness, and supported by other factors in the chart.
The registered Israel chart is the May 14, 1948 proclamation chart set for 16:00 in Tel Aviv. The registered U.S. chart is the contested July 4, 1776 Watters chart set for 02:17 in Philadelphia. Iran has no registered national chart in the current database, so the engine did not invent or select one after seeing the results.
What the scores mean—and what they do not mean
An ensemble score is a weighted relative rank inside this particular 60-day scan. A score of 92.67 means that the component combination ranked very highly compared with other sampled timestamps in the same run. It does not mean there is a 92.67% probability of war.
This distinction is essential. Percentile normalization makes layers with different raw scales comparable, but it does not convert astrological signals into calibrated real-world likelihoods. The experiment tests timing discrimination, not probability forecasting.
Mundane astrology forecast dates: the five September windows
August 11 is the experiment's U.S.-chart forecast date. The five highest combined-score windows all fall in September 2026. The table is chronological, while the rank column preserves the engine's score order. Times are shown in Israel local time.
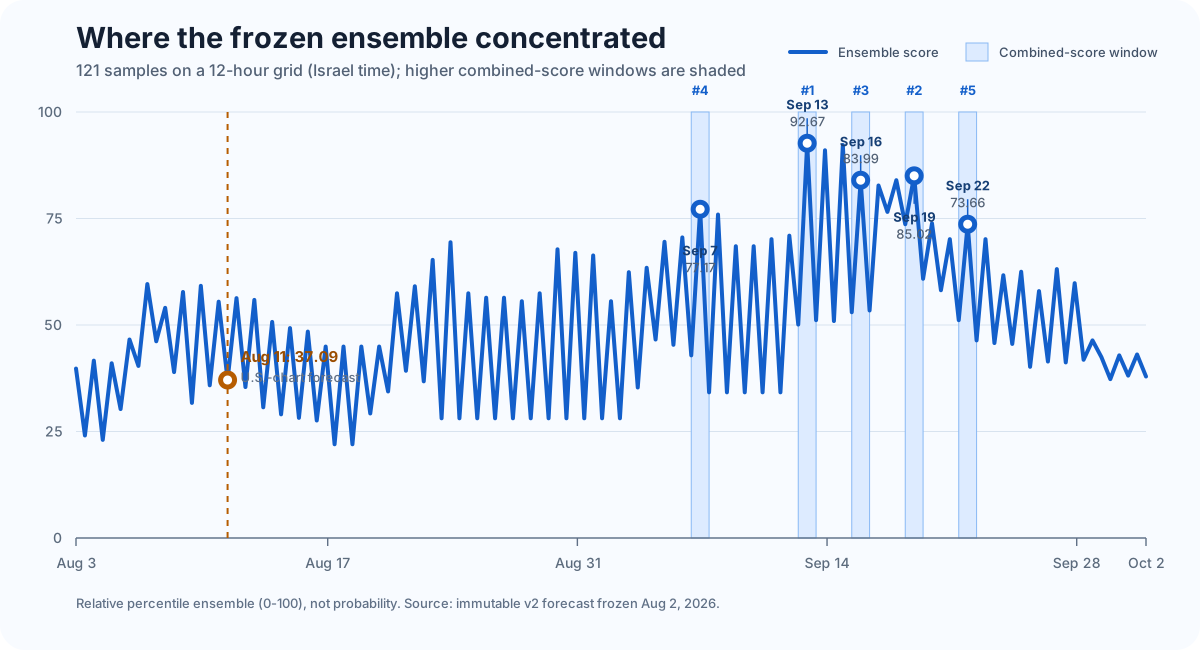
Yes, these results can be shown accurately on a graph. The line above uses all 121 saved scores, and the shaded areas use the five date windows saved by the engine. Before drawing the graph, the site checks that the original result file has not changed. No point or date was placed by hand.
How to read each September date
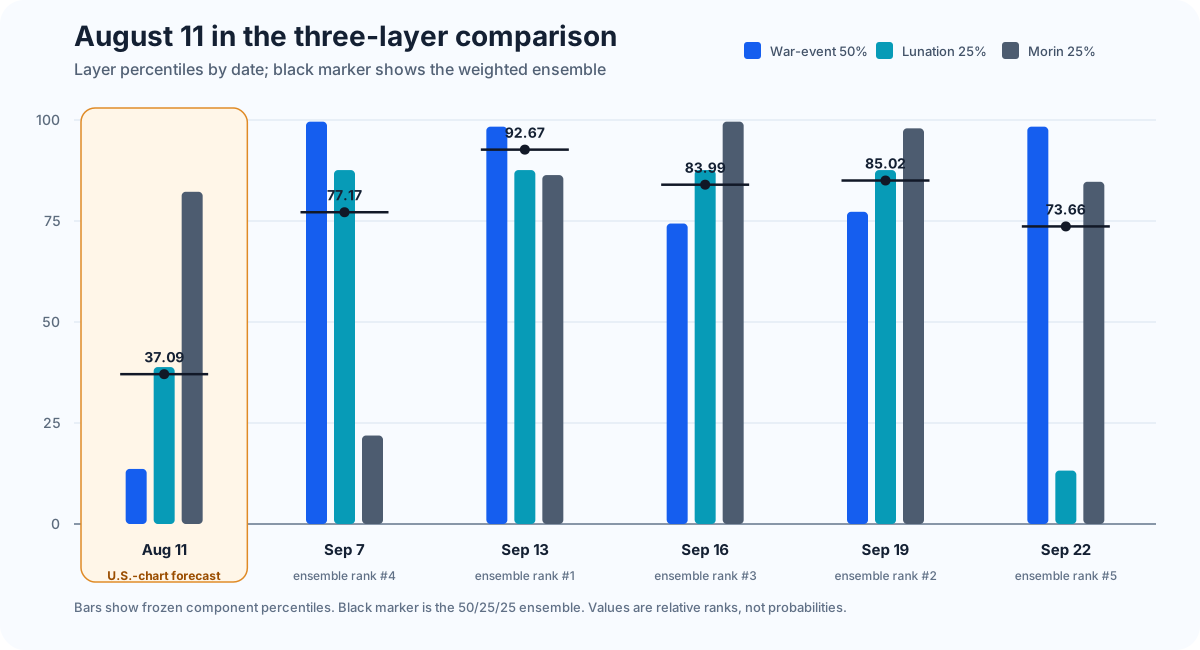
The three numbers in parentheses below are the war-event, lunation, and Morin percentiles. They explain why a date can rank highly for different reasons.
- September 6–7 — rank 4, score 77.17 (99.59 / 87.60 / 21.90): this is an event-and-lunation window. Both national charts have a raw Morin score of zero. The displayed 21.90 is the percentile position created by tied zero rows, not evidence of an active national-chart transit.
- September 12–13 — rank 1, score 92.67 (98.35 / 87.60 / 86.36): the most balanced high point in the run. Strong event and lunation readings coincide with applying Mars squares to the Israel chart's Ascendant and seventh-house cusp.
- September 15–16 — rank 3, score 83.99 (74.38 / 87.60 / 99.59): the strongest Morin percentile. Mars is applying by square to the Israel Ascendant and seventh-house cusp, while also approaching a conjunction with the Midheaven.
- September 18–19 — rank 2, score 85.02 (77.27 / 87.60 / 97.93): the Israel-chart Morin layer includes a partile Mars conjunction to the Midheaven at a 0.9879-degree orb, alongside Mars squares to the Ascendant and seventh-house cusp.
- September 21–22 — rank 5, score 73.66 (98.35 / 13.22 / 84.71): strong war-event and Israel-chart Morin pressure overcome a weak lunation percentile. Mars remains in conjunction range of the Israel Midheaven.
These are five different layer combinations, not five copies of one transit. At every September peak, the U.S. national-chart Morin score is zero; the September national-chart contribution comes from the Israel chart.
Why August 11 is a forecast date
Yes—August 11 is one of the dates forecast by the experiment. The strongest U.S.-chart-only activation is around August 11, but its overall ensemble score is just 37.09.
At the coarse sampled timestamp of August 11 at 12:15 Israel time, transiting Mars opposes the eighth-house cusp in the contested U.S. chart. The contact is partile and applying, with a 0.2688-degree orb. It is the strongest U.S. Morin point on the frozen 12-hour grid, but it is only one layer of the experiment.
The component percentiles are 13.64 for war-event pressure, 38.84 for lunation pressure, and 82.23 for Morin pressure. Applying the frozen weights gives (0.50 × 13.64) + (0.25 × 38.84) + (0.25 × 82.23) = 37.09. In plain language: the U.S. transit is sharp, but the more heavily weighted event-chart engine does not agree. The graph therefore presents August 11 as a U.S.-chart forecast date beside the five stronger September combined-score windows.
This is exactly why a layered method matters. August 11 remains a genuine U.S.-chart forecast date, but it carries less support from the other two layers than the September windows. The later hourly check localized the U.S.-chart contact to approximately 16:15 Israel time on August 11 and slightly strengthened the Morin component, while the five September windows and their ranks remained unchanged.
What the hourly verification sweep added
After the forecast was saved, we ran a closer timing check around the five highest combined-score peaks and the August 11 U.S.-chart forecast. Each date was checked across plus or minus 24 hours at one-hour intervals, producing 294 results. The same three layers and 50/25/25 weights were retained, and the original 121-point timeline remained the ranking reference.
The sweep refined the September ensemble peaks to approximately September 7 at 00:15, September 13 at 19:15, September 15 at 19:15, September 18 at 19:15, and September 22 at 00:15 Israel time. Two coarse peaks remained unchanged, while three shifted within the wider verification range.
One result deserves special attention: the closer hourly check found its strongest point seven hours beyond the saved September 12–13 window. We record that detail, but we cannot widen the original window after seeing it. The original September 12–13 interval remains the one that will be judged.
The most important cross-check: the national-chart signals remain separated
The September Morin pressure comes from the Israel chart. The August 11 activation comes from the U.S. chart. Across the original 12-hour scan, there are zero timestamps where both national-chart Morin scores are positive at once.
The hourly verification gives the same result. Of the 294 fine-resolution rows, not one contains simultaneous positive Israel and U.S. Morin activations. This means the engine output does not justify describing August 11 or any September window as a clean simultaneous Israel–U.S. national-chart signature.
How we checked the inputs and output
The saved forecast includes a digital fingerprint that reveals any later change. Repeating the calculation produced the same results. The forecast passed all 20 checks, covering the spacing of dates, weights, chart choices, rule filters, arithmetic, date selection, and confirmation that no target date had been inserted in advance.
The separate hourly file passed all 11 of its checks across 294 results. Those checks covered the hourly spacing, score arithmetic, strongest-date selection, national-chart signal counts, and the Mars/Saturn rules. The wider Mundane and Morin test set also passed all 124 tests.
The chart and research limitations
- No Iranian national chart: Iran is represented through Tehran event and lunation charts, not a Morin national-chart transit layer.
- The U.S. chart is contested: the 02:17 Watters chart is one candidate among several competing U.S. national horoscopes.
- The weights are experimental: the 50/25/25 ensemble has not yet been prospectively validated across repeated independent forecasts.
- Scores are relative: high rankings identify stronger timestamps inside this one scan, not a real-world probability of conflict.
- The hourly check came later: it can show where a contact becomes strongest, but it cannot rewrite August 11 or the five September windows.
- Astrology is not an intelligence method: no operational, military, political, financial, or safety decision should be based on these dates.
How the mundane astrology forecast will be scored
August 11 will be judged as its own U.S.-chart forecast date in Israel local time. The five September periods will be judged as the combined-score windows shown in the table. An event on August 11 or inside a reported September window is an exact hit for that date. An event within 72 hours before or after a reported date is a near hit. A qualifying event outside every exact and near interval is a miss, and each date without a qualifying event remains a false alarm.
If no qualifying event occurs during the 60-day period, the experiment does not get to reinterpret rhetoric, proxy activity, or unrelated incidents as success. August 11 and all five September windows remain documented false alarms under the stated event definition.
What this experiment can actually teach us
This forecast does not prove that a war will occur. It records a repeatable astrological timing forecast with a clear start time, stated chart choices, fixed scoring, narrow dates, saved source files, and a clear definition of failure.
It also does not answer when the Iran war will end. The protocol looks only for a new, independently verified direct interstate action during the observation period; it does not forecast a ceasefire, peace agreement, political settlement, or the ultimate outcome of the conflict.
That structure makes the eventual outcome informative. If the dates fail, the miss remains visible. If a window aligns, it can be evaluated without pretending the other windows disappeared. Repeating this process across independent forecasts is the only responsible way to learn whether the engine is detecting more than attractive patterns.
Readers interested in the broader timing workflow can explore the Astro Clock transits guide, our Princess Diana transit-scanner backtest, and the separate discussion of electional astrology and conflict timing.
FAQ
What is mundane astrology?
Mundane astrology applies astrological techniques to collective subjects such as states, governments, public events, conflict, economic conditions, and social change rather than to one person's natal life.
When is another Iran–Israel–U.S. war escalation expected?
This experimental astrology forecast records August 11 and five September 2026 windows: September 6–7, 12–13, 15–16, 18–19, and 21–22. They are dates to test, not reliable geopolitical probabilities or a promise that escalation will occur.
Will the Iran war escalate further or end?
Vox Stella cannot establish that from this run. The experiment tests whether a new direct interstate action occurs near one of six recorded dates. It does not forecast the war's end, a ceasefire, or the wider political outcome.
Did Vox Stella predict a war on August 11?
Yes—August 11 is one of the experiment's forecasted dates, based on the strongest U.S.-chart-only Morin activation in the run. Its overall ensemble score is 37.09, so it has less support from the full three-layer method than the five stronger combined-score windows in September. It is an astrological forecast date, not a certainty.
Which dates did the experiment flag?
The experiment records August 11 as the U.S.-chart forecast date. The five stronger combined-score windows are September 6–7, September 12–13, September 15–16, September 18–19, and September 21–22, 2026, in Israel local time.
Are the ensemble scores probabilities?
No. They are weighted percentile rankings inside this one 60-day scan. A score of 92.67 is not a 92.67% chance of conflict.
Why is there no Iranian national-chart transit score?
The current Vox Stella registry has no accepted Iranian national chart. The experiment preserves that gap rather than choosing a chart after seeing the output.
Which Vox Stella features were used?
The protocol automated Astro Clock's Mundane Analysis engine with War Event/War Outbreak and Lunation/Campaign Escalation configurations, then combined those results with the Astro Clock Morin transit engine and registered national charts.
Can an AI assistant use Vox Stella?
Yes. After Vox Stella is activated on a Windows computer, its MCP connection lets an AI assistant request calculations for Synastry, Trait Profile, Transits, Astrocartography, Election, Chinese Astrology, Forensic, and Certification. The conflict test in this article still follows its own research plan; it is not a one-click prediction.
How were the graphs generated?
The charts use the saved forecast's 121 timeline results and five date windows. Before drawing them, the site checks that the original result file has not changed, so the graphics cannot quietly tell a different story.
Can the later hourly check change the original forecast?
No. The hour-by-hour review only gives a closer look at timing. The experiment must still be judged against August 11 and the five September windows already stated.