
Before You Start
In Astro Clock, click Mundane in the Places group of the Tools bar. Astrocartography, Mundane and Weather share one window with three tabs; close it with the close button or press Escape.
- Mundane doesn't need a saved chart. It reads a registered national chart, or a chart you enter yourself.
- It has two modes: Scan, which opens first, and Analysis.
- Every result sits under the window's own notice: "Astrological reading of mundane charts for research and interest only. It is not a political, security, economic or public-health forecast, and scores are not probabilities."
Screen At A Glance
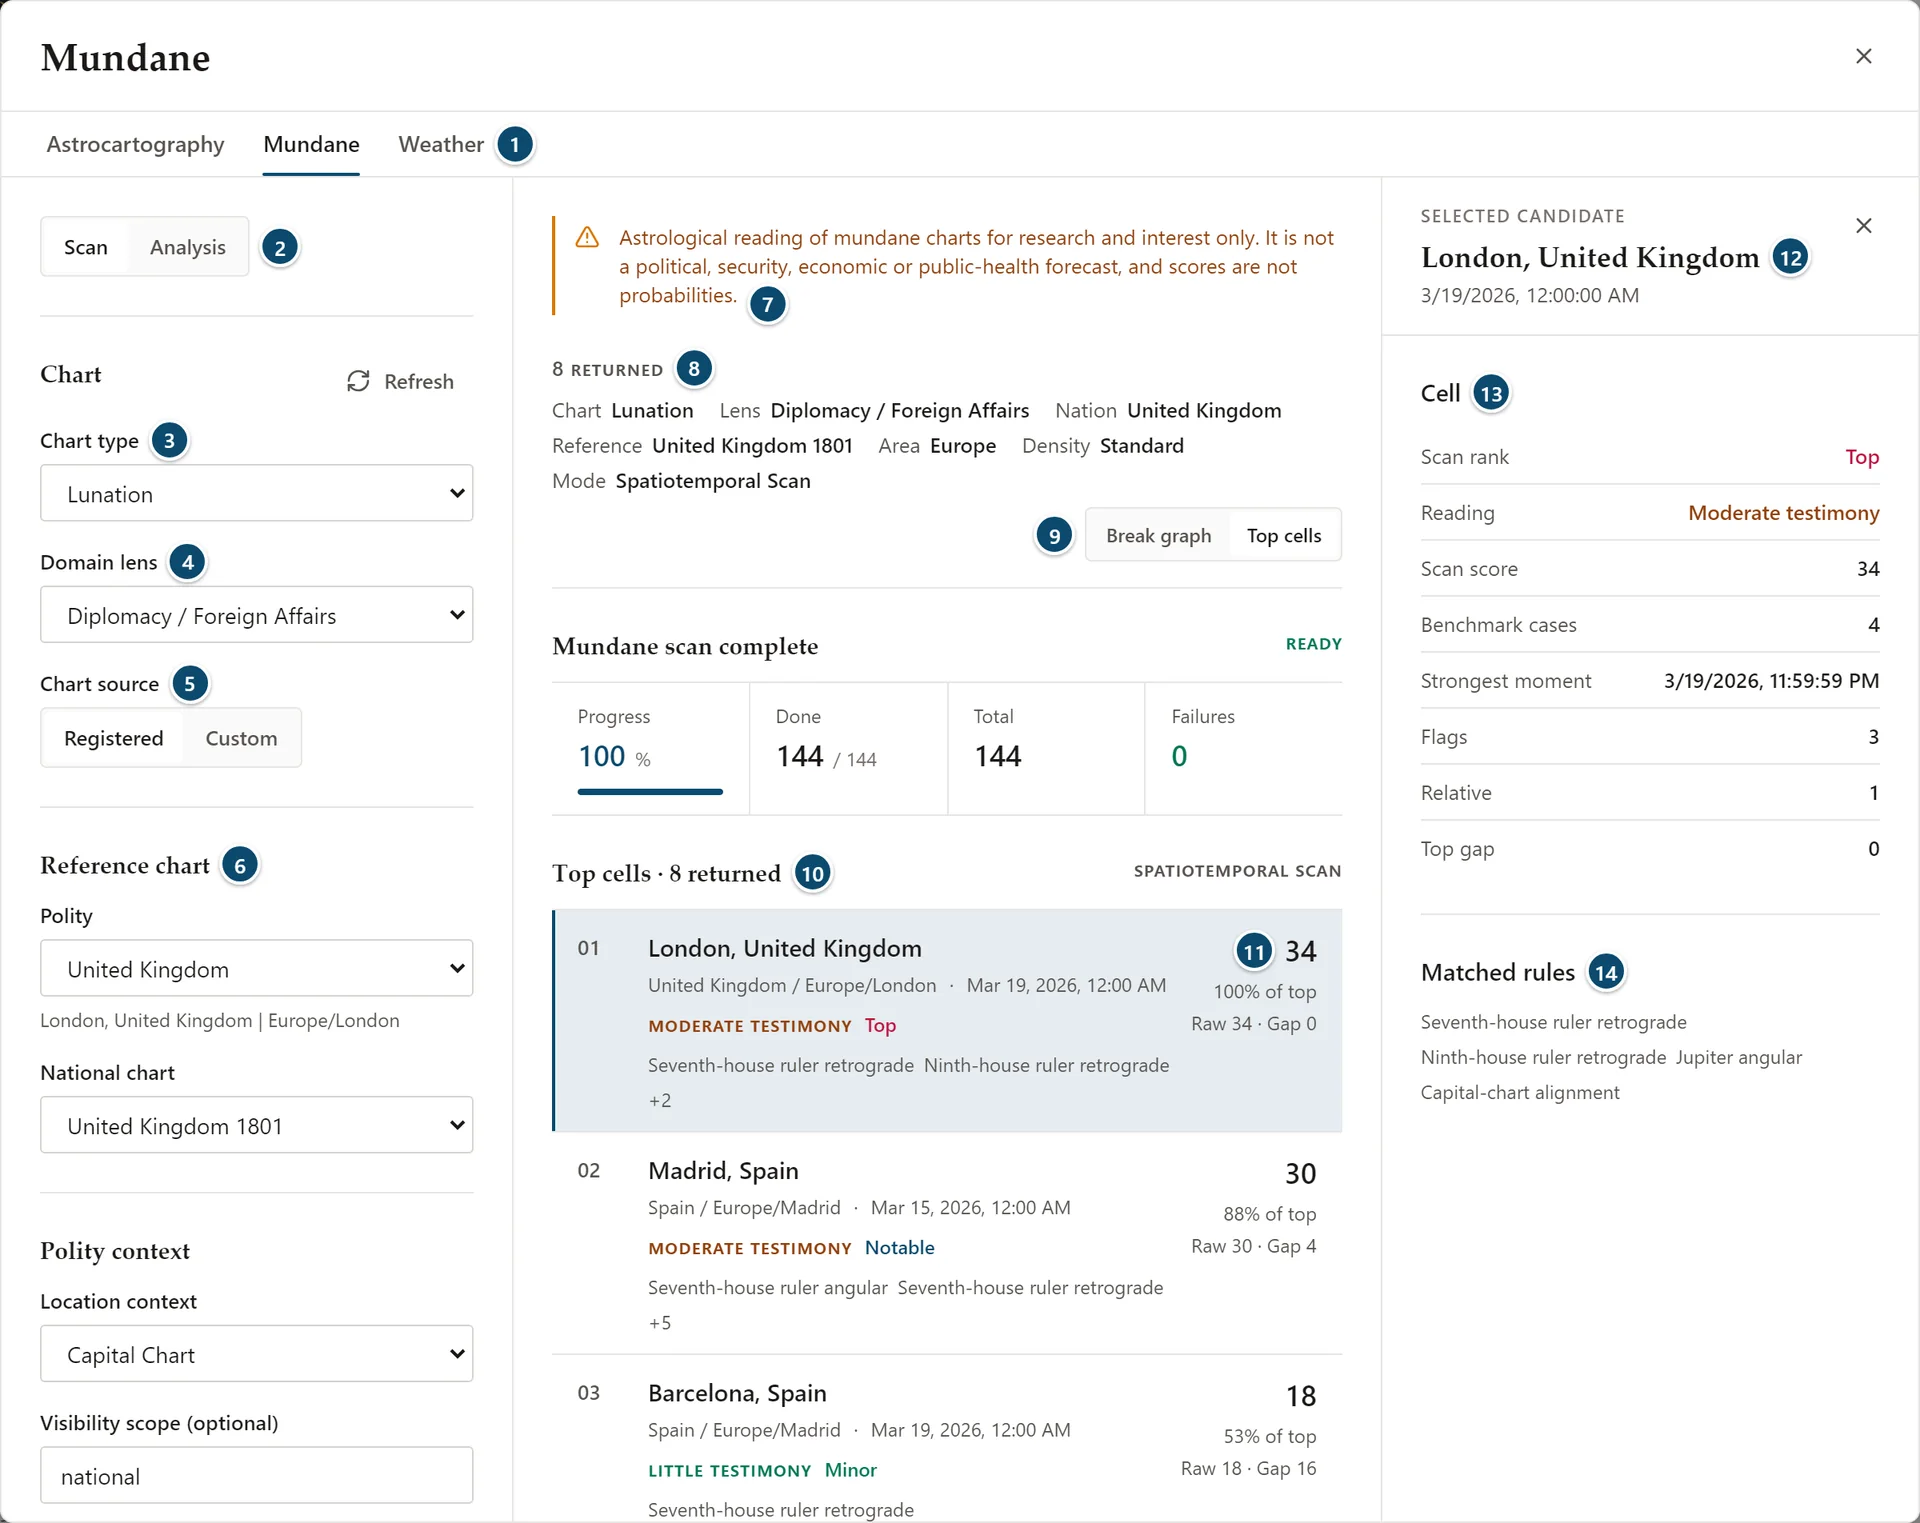
- Astrocartography, Mundane and Weather tabs
- Scan or Analysis
- Chart type
- Domain lens
- Chart source: Registered or Custom
- Reference chart: Polity and National chart
- The research notice
- Scan summary: results returned, chart, lens, nation, reference, area, density and mode
- Break graph or Top cells
- Top cells
- A top cell's score, share of the top score, raw score and gap
- Side inspector for the selected cell
- Cell
- Matched rules
The window has three parts: the setup column on the left, the results in the middle, and a side inspector on the right that opens when you select a result. Close the inspector with its own close button, or click the selected result again.
Choosing The Chart
The Chart panel sets what is read:
- Chart type: Aries Ingress, Lunation, Eclipse or War Event. Analysis also offers National Chart.
- Domain lens: the question the chart is read for, such as Regime Stability, Finance / Economy, Trade / Commerce, Public Health or Diplomacy / Foreign Affairs. The list puts the Preferred lenses for the chart type first and Other supported lenses after them.
- Chart source: Registered or Custom.
With Registered, choose the country under Reference chart:
- Polity, with its capital and time zone shown underneath
- National chart: one of the polity's registered charts
With Custom, enter your own reference chart: Polity name, Chart name (optional), Date, Time, Location and Time zone. In Analysis the window notes that custom charts stay exploratory: they are user-supplied, unverified and not in the registry.
Polity context (in Analysis, Context overrides) sets the Location context, such as Capital Chart, and an optional Visibility scope.
Running A Scan
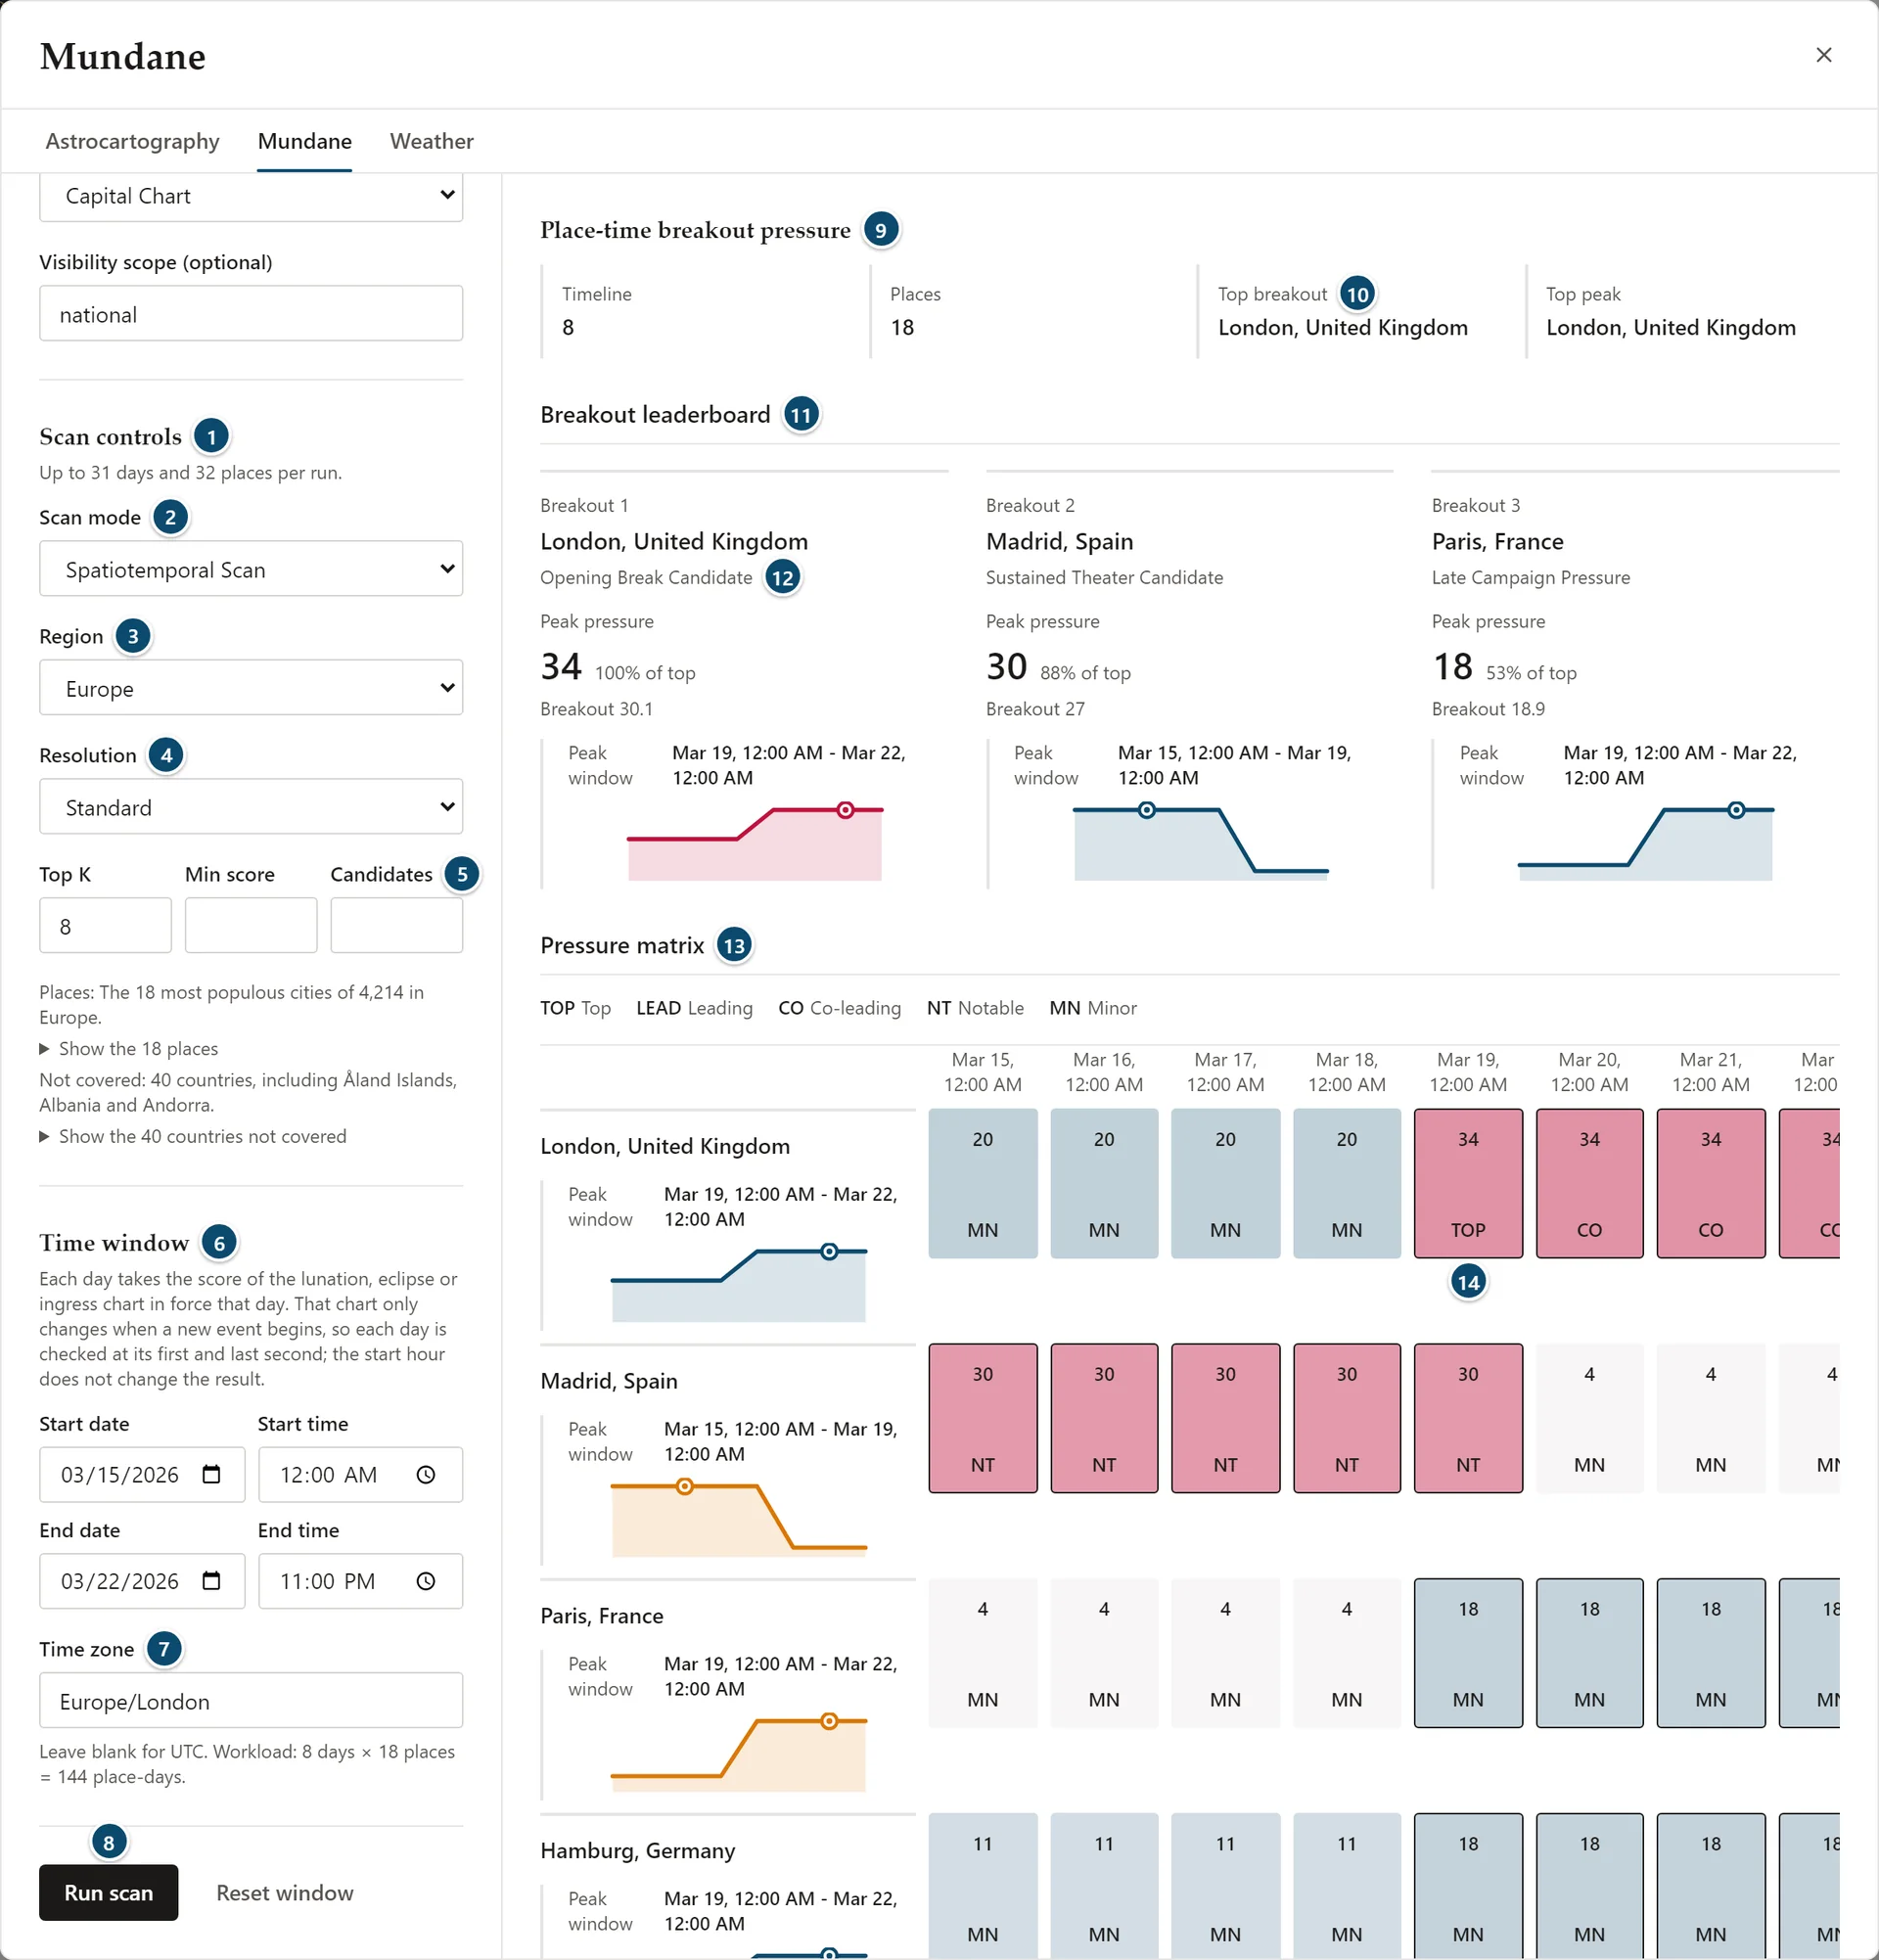
- Scan controls, with the mode's limit
- Scan mode
- Region
- Resolution
- Top K, Min score and Candidates
- Time window
- Time zone, with the estimated workload
- Run scan
- Place-time breakout pressure
- Top breakout and Top peak
- Breakout leaderboard
- The kind of breakout
- Pressure matrix
- A day's score and scan rank
Scan mode decides what the scan covers:
- Spatial Scan: one fixed time across many places. Set the date, time and time zone under Fixed event anchor.
- Spatiotemporal Scan: places and days together. Set a start and end under Time window.
- Long-Range Async Scan: a longer window with fewer candidates by default.
Scan controls shows the limit of the chosen mode, for example "Up to 31 days and 32 places per run." The other controls are:
- Region: from Global to a continent or a smaller area such as Eastern Europe or East Asia
- Resolution: Coarse, Standard, Fine or Ultra
- Top K: how many results to return
- Min score and Candidates (both optional)
Below them, the window says which places the scan covers, for example "The 18 most populous cities of 4,214 in Europe", and which countries those places leave out. Show the 18 places lists them.
Under Time window, the window explains how each day is scored. For Lunation, Eclipse and Aries Ingress, each day takes the score of the chart in force that day, checked at its first and last second. For War Event, each local day is scored at its strongest moment, on an hourly grid plus the exact times planets cross the angles. Either way, the start hour doesn't change the result. Leave Time zone blank for UTC; below it the window shows the workload, for example "8 days × 18 places = 144 place-days."
Click Run scan. A progress panel shows how many place-days are done, the total and any failures. Reset window clears the dates.
Reading Scan Results
A summary above the results gives the number of results returned, then repeats the chart, lens, nation, reference chart, area, density and mode.
A Spatiotemporal Scan has two views:
- Break graph: how pressure moves across places and days
- Top cells: the ranked place-and-day results
A Spatial Scan covers one moment, so it shows Top cells only.
Top Cells
Each top cell shows:
- its rank, the place, its country and time zone, and the date
- a reading, such as Little testimony or Moderate testimony
- its scan rank: Top, Leading, Co-leading, Notable or Minor
- the first matched rules
- the scan score, its share of the top score, the raw score and the gap to the top
The reading describes how much testimony the chart shows. The scan rank only compares the result with the others in the same scan.
Break Graph
Place-time breakout pressure opens with the number of days and places, the Top breakout and the Top peak. Below it:
- Breakout leaderboard: the three leading places, each with its kind of breakout (such as Opening Break Candidate or Sustained Theater Candidate), its peak pressure and share of the top, its Breakout value and a small graph of its peak window
- Pressure matrix: one row per place and one column per day, with each day's score and a scan-rank code (TOP, LEAD, CO, NT or MN)
The Side Inspector
Select a top cell to open Selected candidate:
- Cell: Scan rank, Reading, Scan score, Benchmark cases, Strongest moment, Flags, Relative and Top gap
- Matched rules
In Break graph, select a place to open Selected breakout place, with its Peak pressure, Breakout, Kind and Peak mode.
About This Scan
Below the results, About this scan has two panels:
- Measured performance: for War Event scans, how many hindcasts passed and what chance alone would give, marked in-sample. For the other chart types it says "No scan hindcast exists for this chart type." A note repeats how each day is scored.
- Research scope: the region, resolution, candidates, days, evaluated place-days, places and top cells
Analysis Mode
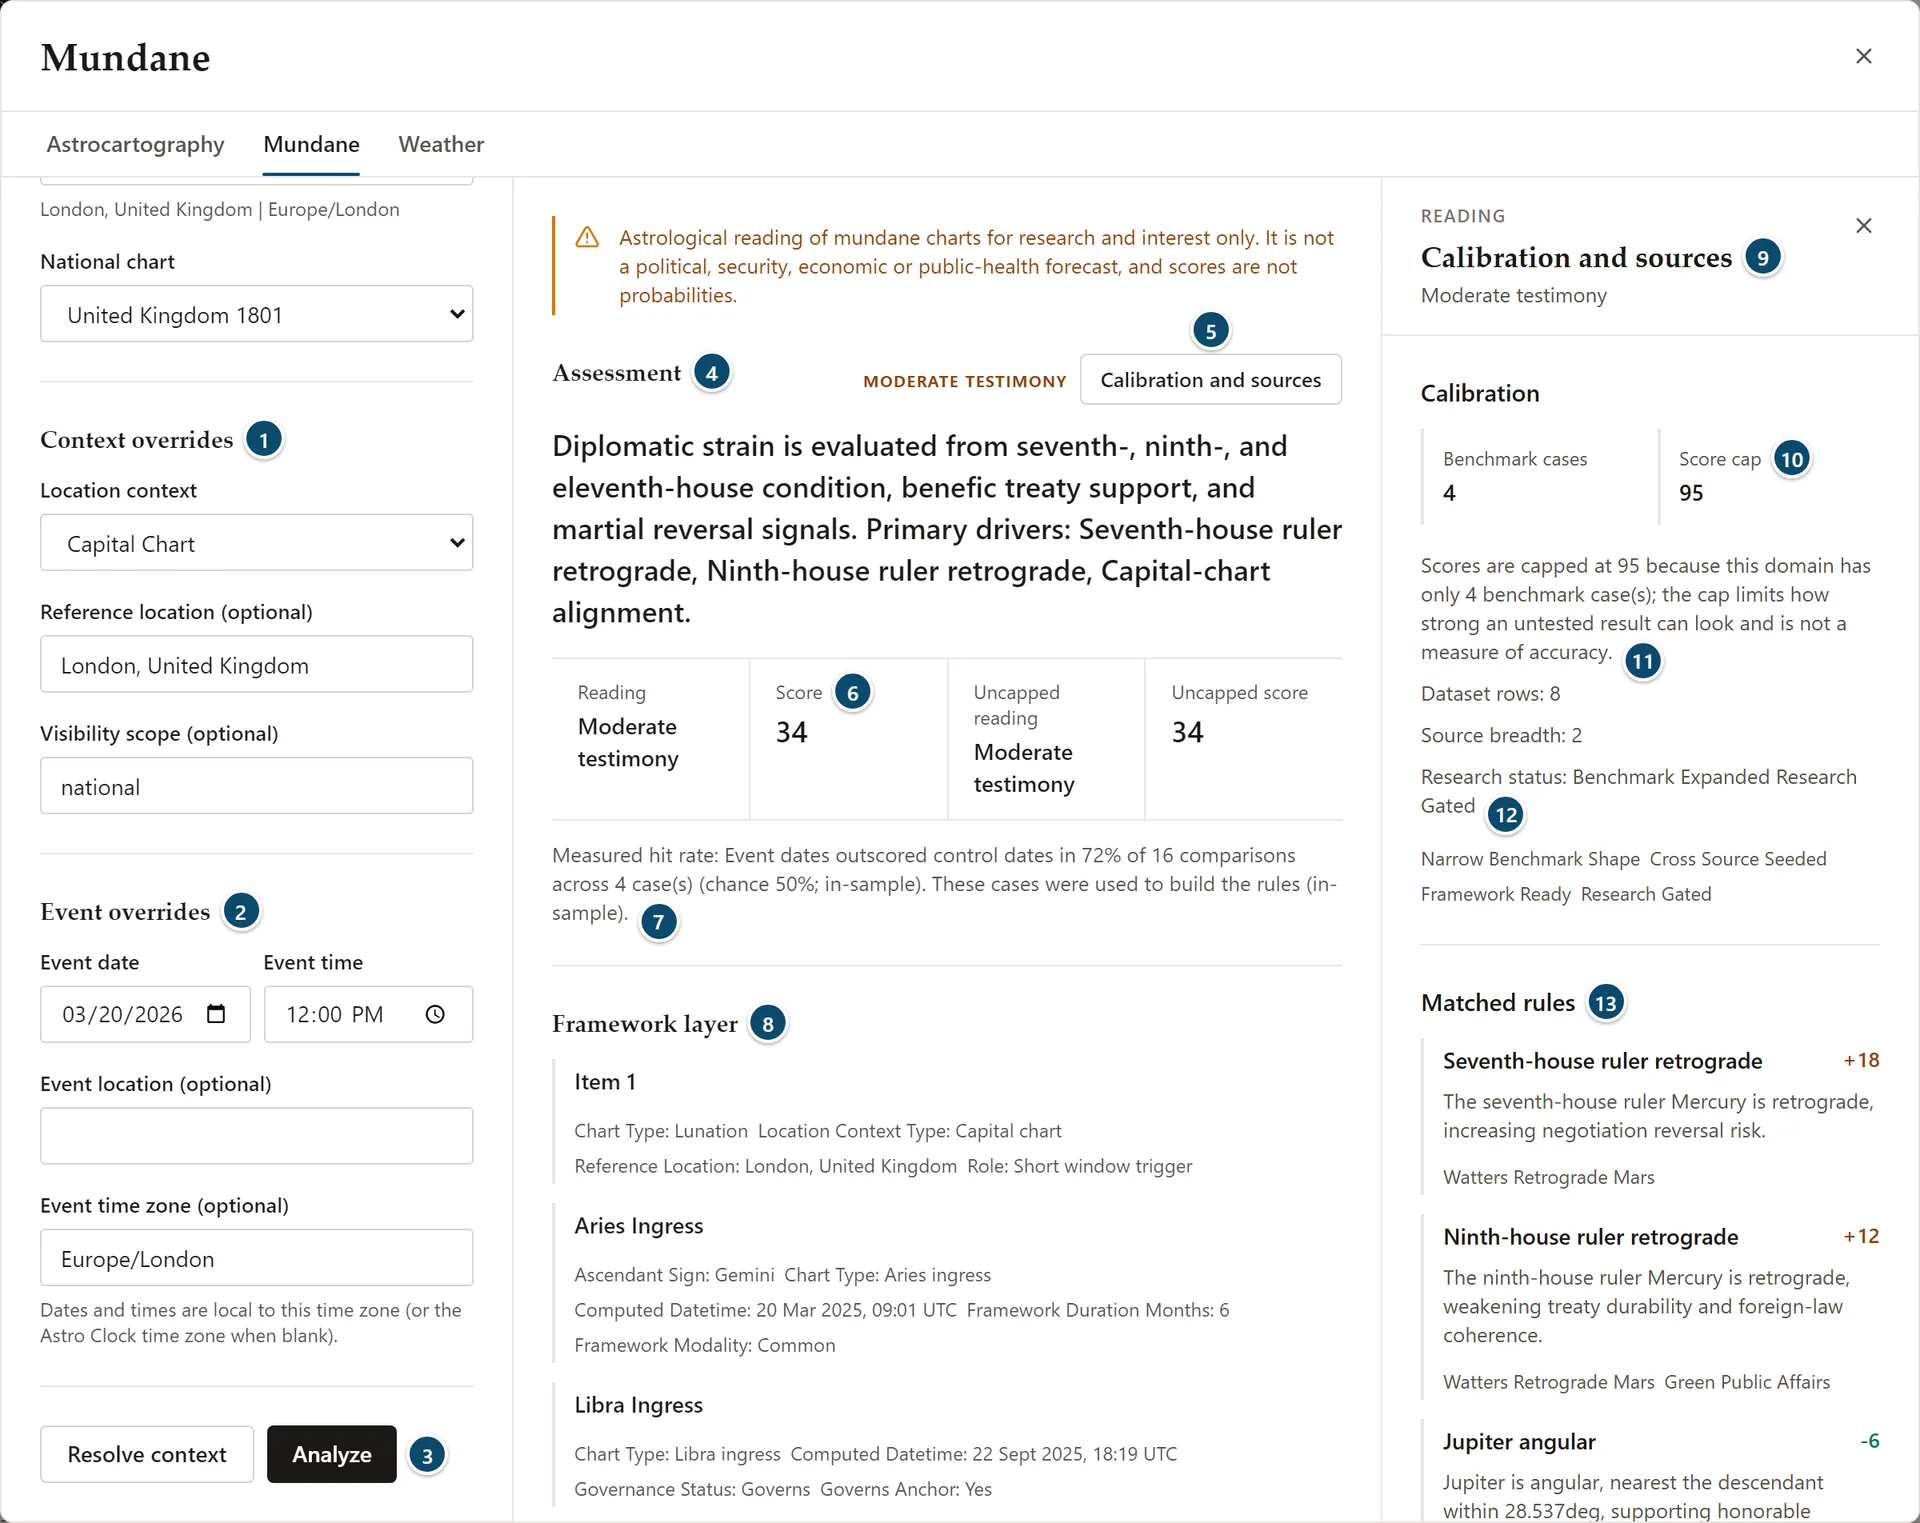
- Context overrides
- Event overrides
- Resolve context and Analyze
- Assessment, with its reading
- Calibration and sources
- Reading, Score, Uncapped reading and Uncapped score
- Measured hit rate
- Framework layer, the first of the reading's layers
- Side inspector: Calibration and sources
- Benchmark cases and Score cap
- Why the score is capped
- Research status and flags
- Matched rules, with their weights
Analysis reads one date in full. Below the chart setup:
- Context overrides: Location context, Reference location (optional) and Visibility scope (optional)
- Event overrides: Event date, Event time, Event location (optional) and Event time zone (optional). Dates and times are local to that time zone, or to the Astro Clock time zone when it is blank.
Resolve context shows the chart stack without a reading. Analyze adds the reading:
- Assessment: the reading, a summary of what was weighed and its main drivers, the Score, and the Uncapped reading and Uncapped score before any cap
- Measured hit rate: for example, event dates outscoring control dates in a share of comparisons across a few cases, with the chance rate. When the cases were used to build the rules, the window says so (in-sample).
- Framework layer, Trigger layer and Activation layer: the items each layer found, such as the governing ingress, the preceding lunation or an angularity check, each with its details (for example the chart type, the location context and when the chart falls, in UTC)
- Domain notes
- Chart stack and frame: the chart type, domain, polity, location context, reference chart and event time, the primary chart, and signals such as the governing ingress and the ingress schedule
Calibration And Sources
Click Calibration and sources to open them in the side inspector:
- Calibration: Benchmark cases and Score cap, with the reason for the cap, then dataset rows, source breadth, the research status and its flags
- Matched rules: each rule with its weight and the sources behind it; a positive weight adds to the score and a negative one takes away
- Matched rule sources and Doctrine sources
- Chart type notes and Context notes
The window explains that the score cap limits how strong an untested result can look, and is not a measure of accuracy.
What Mundane Can And Can't Tell You
- It reads charts by the rules of mundane astrology. It is not a political, security, economic or public-health forecast, and scores are not probabilities.
- Readings describe astrological testimony. Scan ranks and shares of the top score only compare results within one scan.
- Measured hit rates come from a small number of benchmark cases, and the window says when they are in-sample.
- A custom reference chart is exploratory and unverified.
Practical Workflow
- Open Mundane from the Places group.
- Choose the chart type and the domain lens.
- Choose a polity and national chart, or enter a custom chart.
- In Scan, choose the scan mode, region and dates, then click Run scan.
- Read Break graph or Top cells, and select a result for the side inspector.
- Switch to Analysis to read one date in full and check its calibration and sources.
Notes
- No saved chart is needed.
- Scan and Analysis have separate settings.
- Changing the region, resolution or time window changes the workload; the window shows the mode's limit before you run.
- Scores are not probabilities, and a capped score is not a measure of accuracy.