
Before You Start
In Astro Clock, click Weather in the Places group of the Tools bar. Astrocartography, Mundane and Weather share one window with three tabs; close it with the close button or press Escape.
- Weather doesn't need a saved chart. You give it a place, or a region, and the dates.
- It has two modes: Scan, which opens first, and Analysis.
- Every result sits under the window's own notice: "Astrological weather reading for research and interest only. It is not a weather forecast, watch or warning; rely on your national weather service for safety decisions."
Screen At A Glance
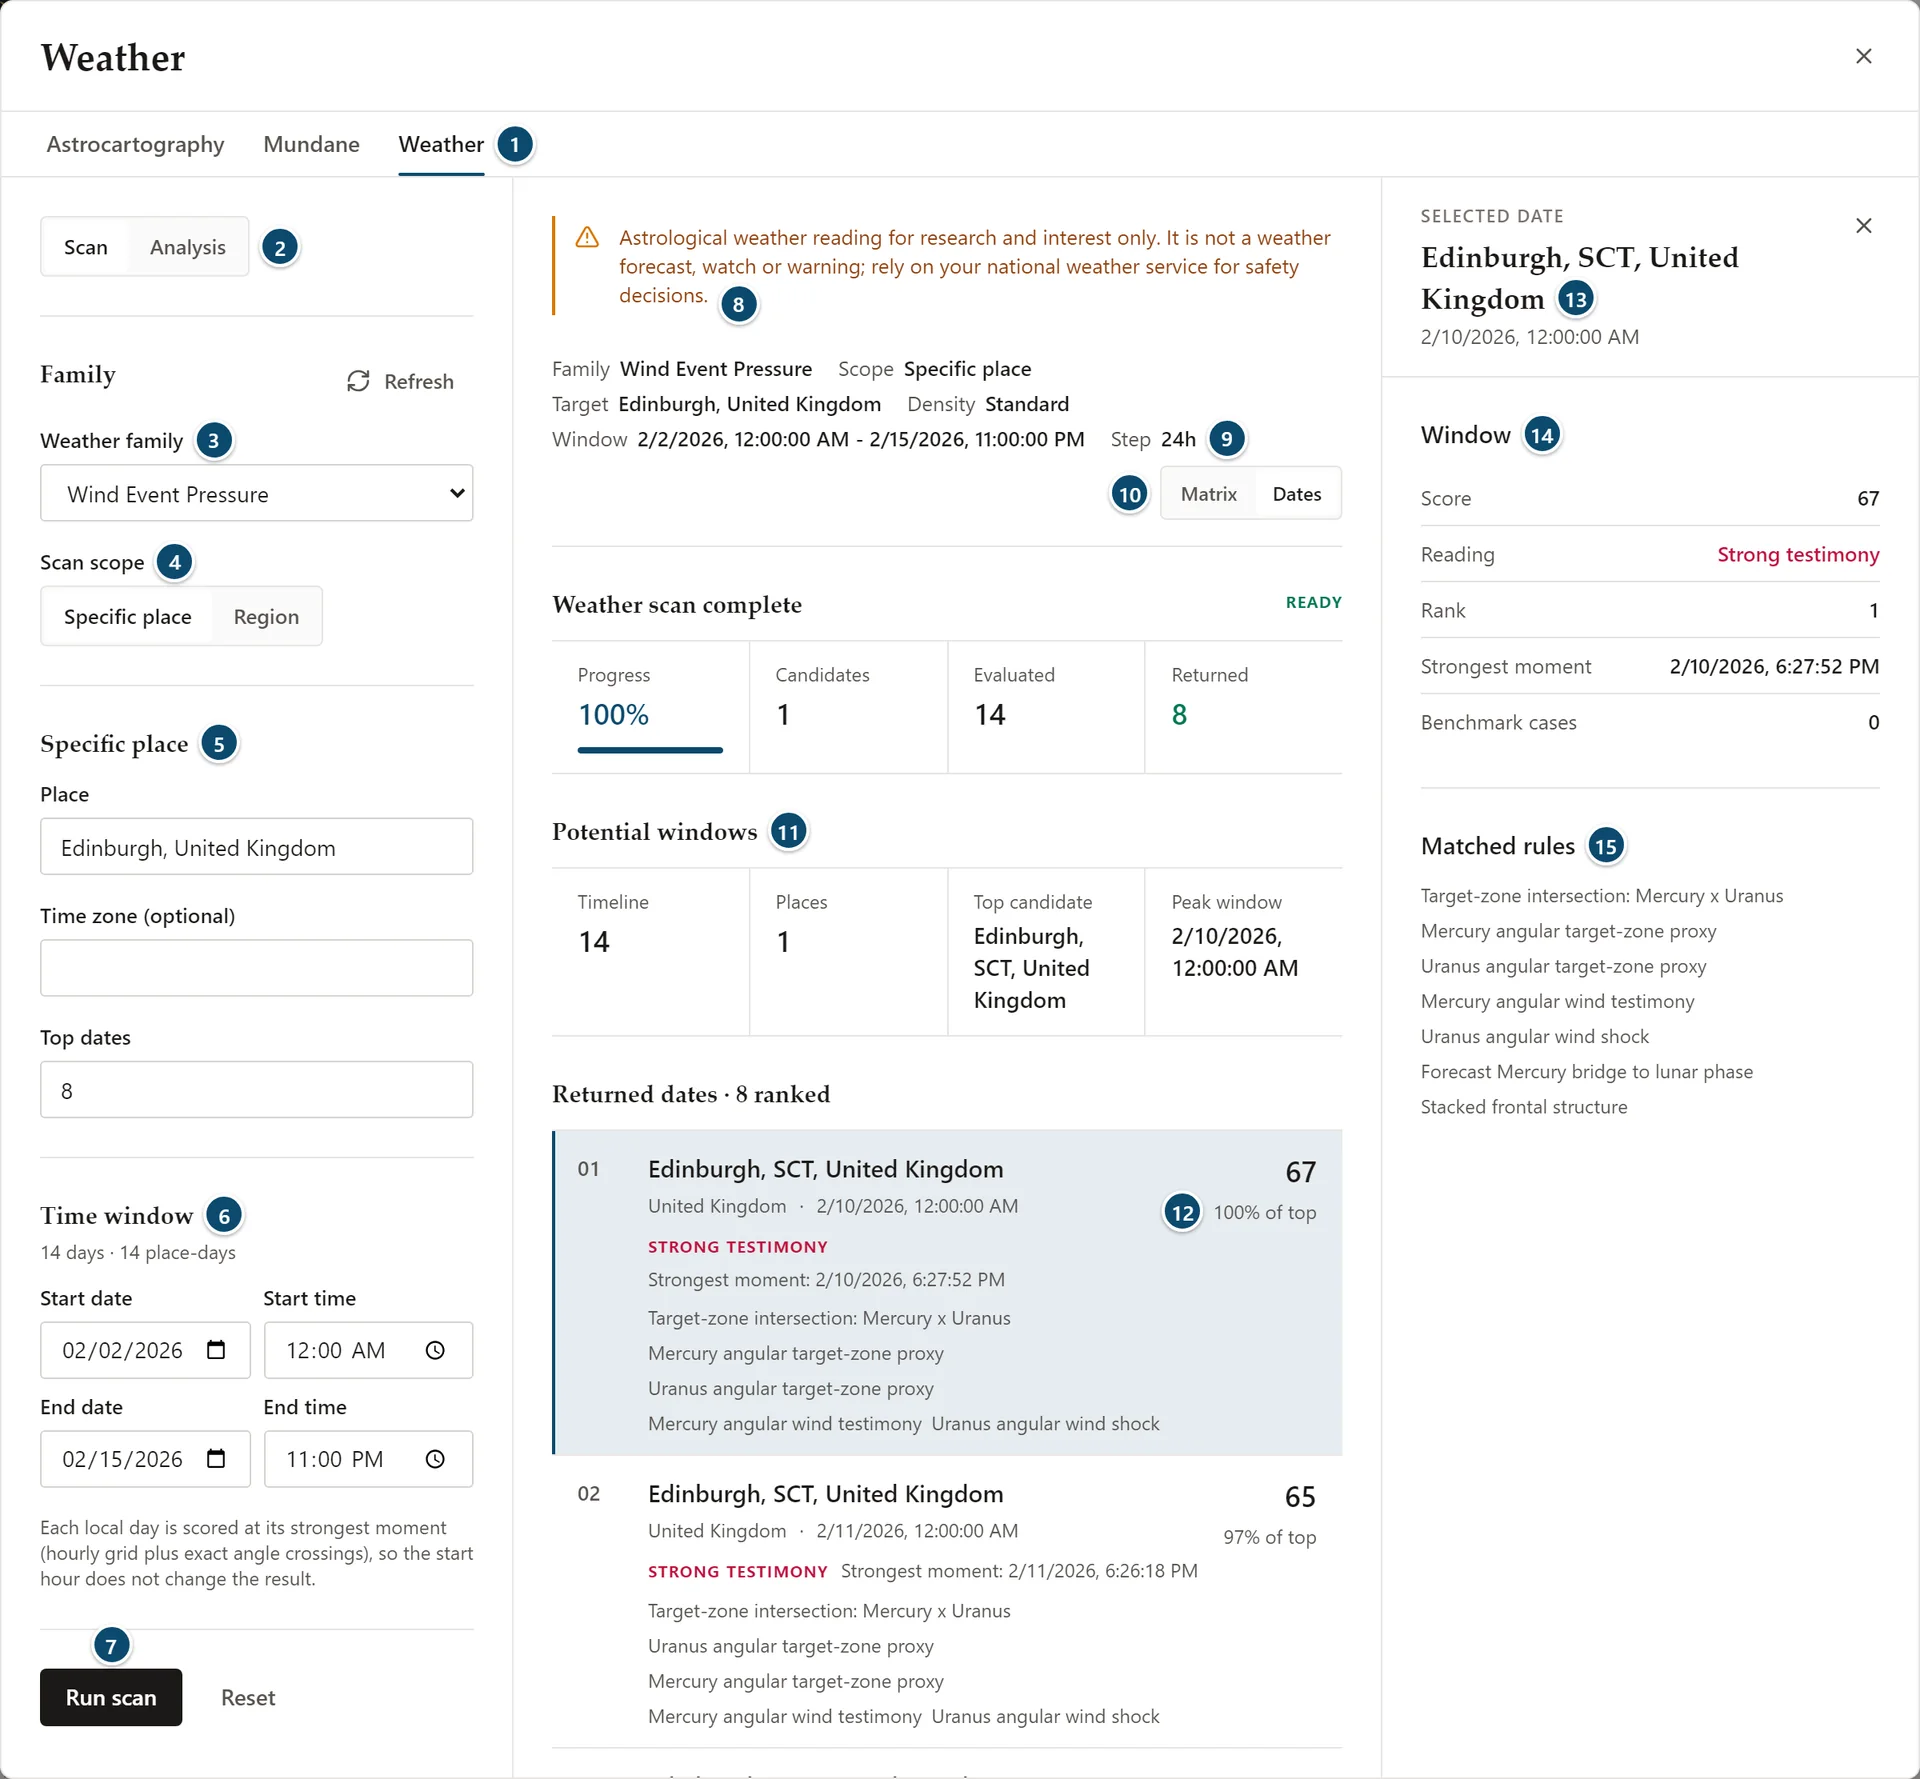
- Astrocartography, Mundane and Weather tabs
- Scan or Analysis
- Weather family
- Scan scope: Specific place or Region
- Specific place: the place, an optional time zone and the number of dates
- Time window, with the number of days
- Run scan
- The research notice
- Scan summary: family, scope, target, density, window and step
- Matrix or Dates
- Potential windows
- A returned date's score and share of the top score
- Side inspector for the selected date
- Window
- Matched rules
The window has three parts: the setup column on the left, the results in the middle, and a side inspector on the right that opens when you select a result. Close the inspector with its own close button, or click the selected result again.
Weather Families
Weather family sets the kind of signature the rules look for:
- Flood Risk
- Hurricane Pressure
- Severe Convective Pressure
- Wind Event Pressure
Scanning One Place
With Scan scope set to Specific place:
- Place: the place to scan, such as a city and country
- Time zone (optional)
- Top dates: how many dates to return
Under Time window, set the Start date, Start time, End date and End time. The panel shows how many days and place-days the scan covers. The window explains that each local day is scored at its strongest moment, on an hourly grid plus the exact times planets cross the angles, so the start hour doesn't change the result.
A scan covers at most 31 days; a longer window is refused with "Weather scan is limited to 31 days." Click Run scan, or Reset to clear the place and dates.
Scanning A Region
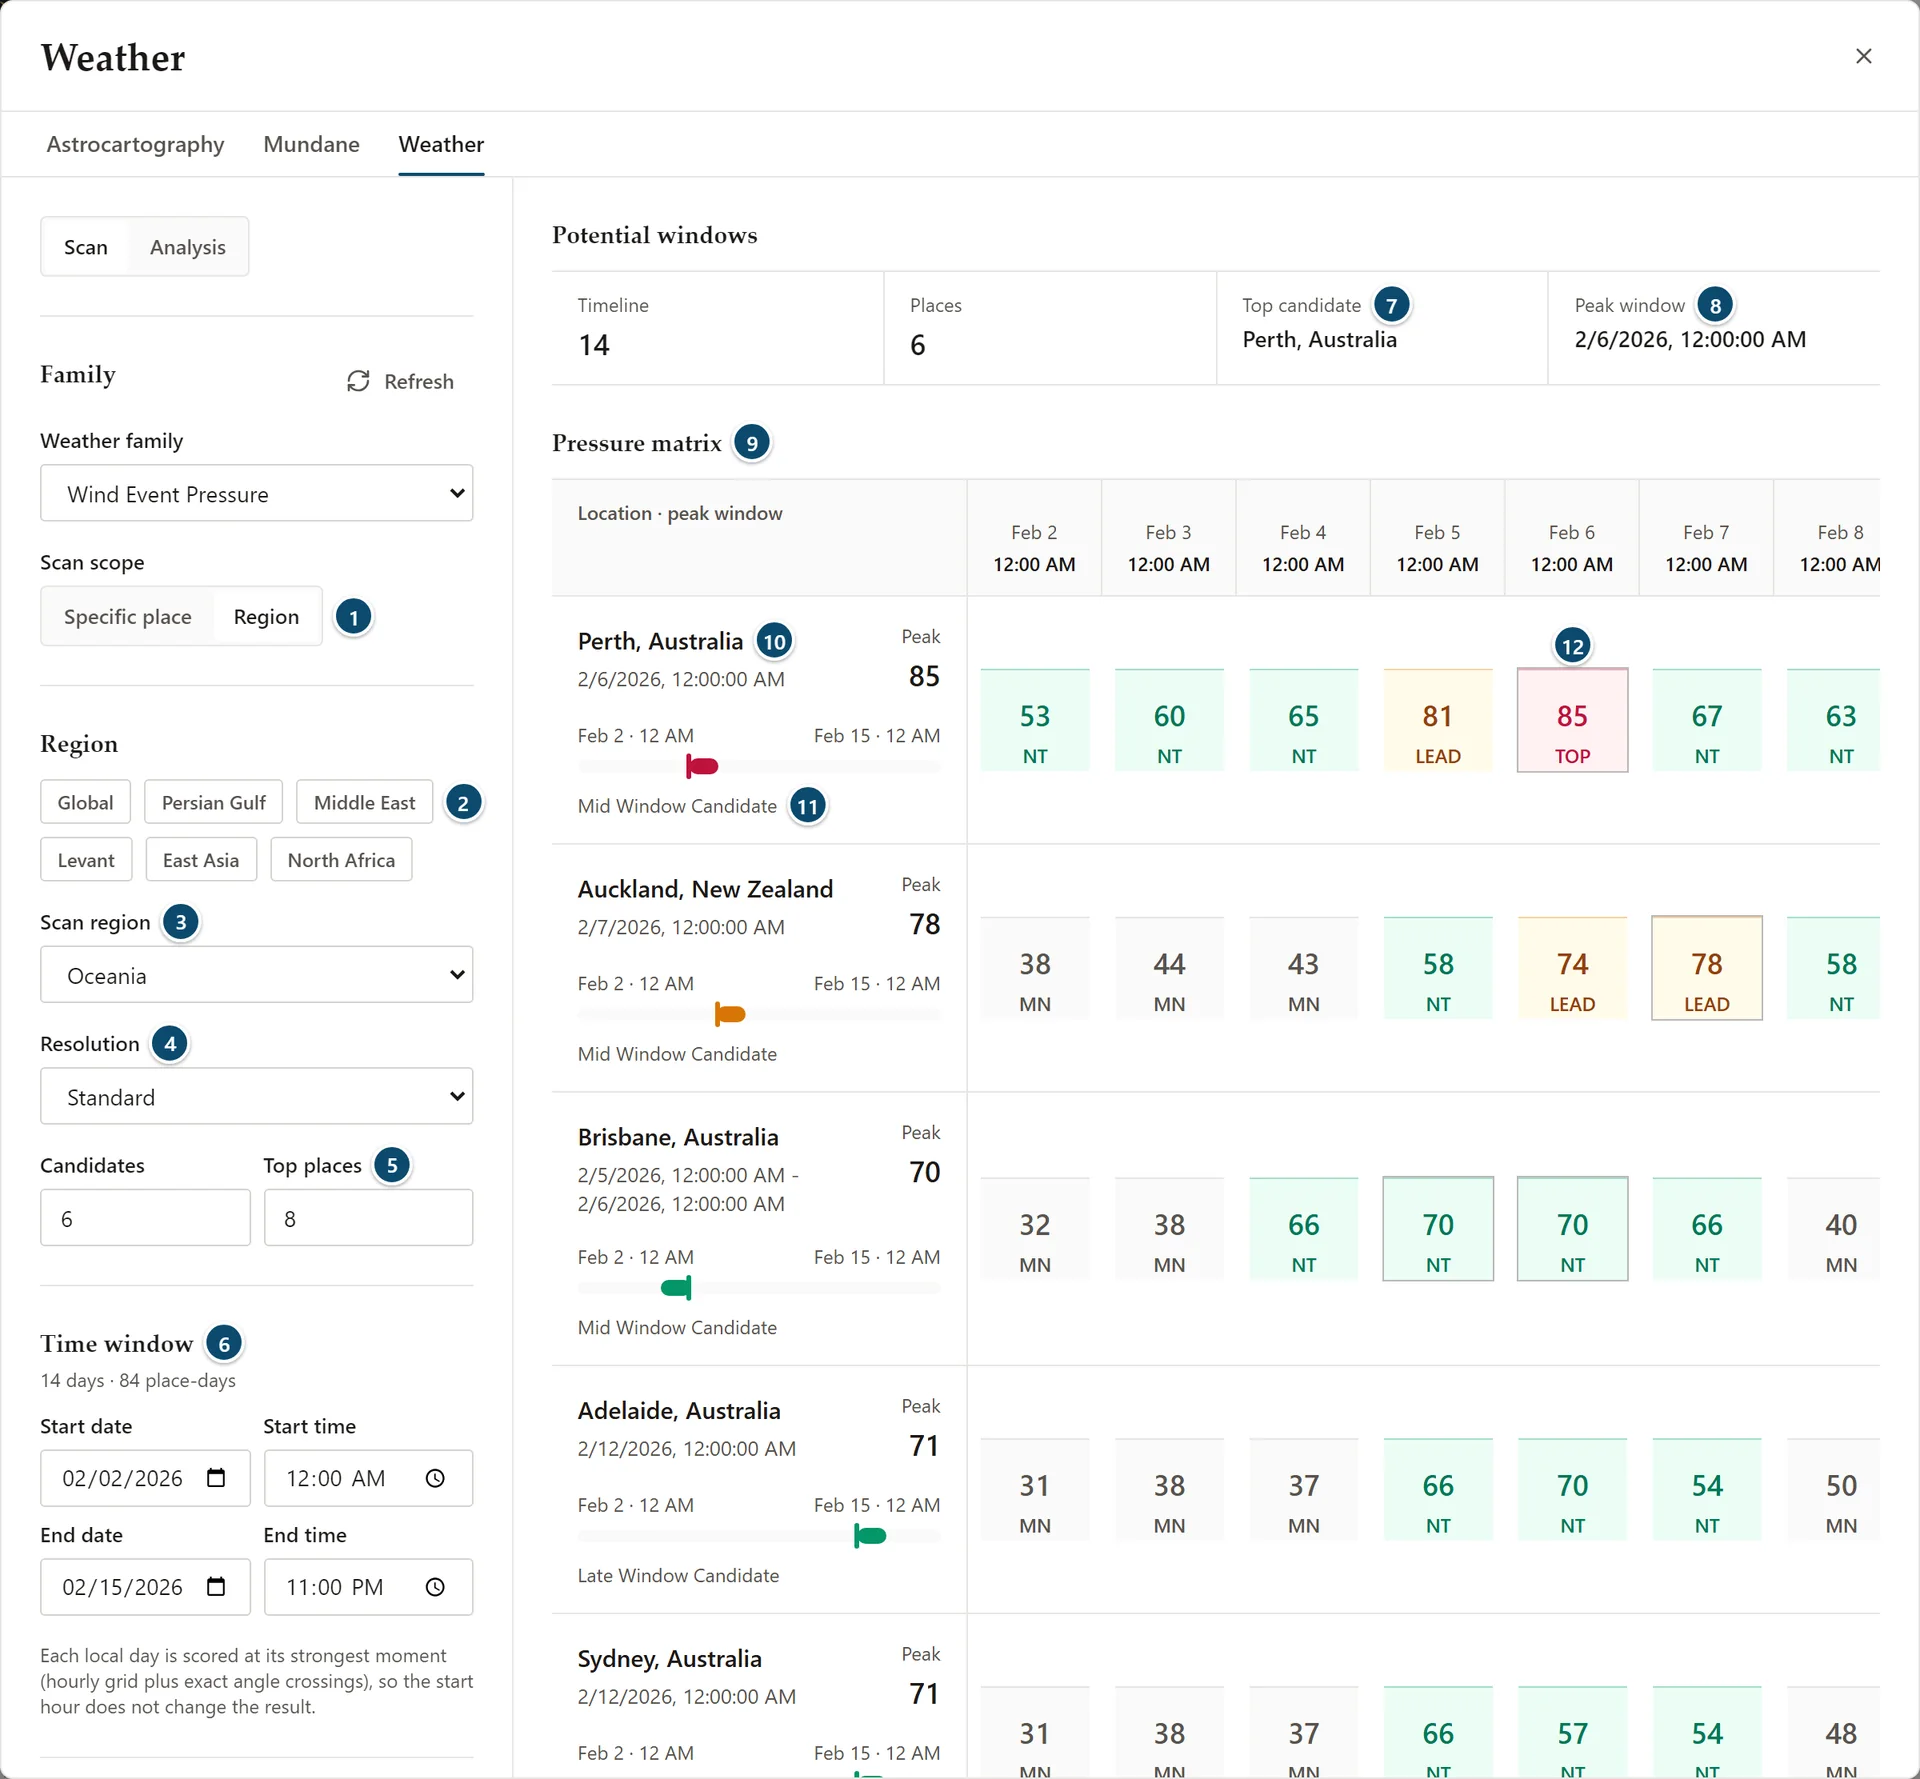
- Scan scope: Region
- Featured regions
- Scan region
- Resolution
- Candidates and Top places
- Time window, with the days and place-days
- Top candidate
- Peak window
- Pressure matrix
- A place, its peak window and peak score
- Where the peak falls in the window, and its kind
- A day's score and scan level
With Scan scope set to Region:
- Featured region buttons, and Scan region for the full list, from Global to a continent or a smaller area
- Resolution: Coarse, Standard, Fine or Ultra
- Candidates: how many places in the region to score
- Top places
The days multiplied by the candidates give the place-days shown under Time window. A scan is limited to 186 of them; above that the window says "Weather scan is limited to 186 evaluated cells." Shorten the window or lower the candidates.
Reading Scan Results
A summary line above the results repeats the family, scope, target, density, window and step. Below it, a progress panel shows Progress, Candidates, Evaluated and Returned.
Potential windows sums up the scan: the number of days and places, the Top candidate and its Peak window.
The results have two views:
- Matrix: the Pressure matrix, one row per place and one column per day
- Dates: the Returned dates, ranked
Matrix
Each place row shows its peak window and Peak score, a bar marking where the peak falls between the first and last day, and the kind of window, such as Early Peak Candidate, Mid Window Candidate or Late Window Candidate. Each day's cell shows its score and a short scan-level code, such as TOP, LEAD, NT or MN.
Dates
Each returned date shows its rank, the place and country, the date, a reading such as Strong testimony, the strongest moment of that day, the matched rules, the score and its share of the top score.
The Side Inspector
Select a date to open Selected date:
- Window: Score, Reading, Rank, Strongest moment and Benchmark cases
- Matched rules
In Matrix, select a place to open Selected place, with its Peak score, Scan level, Kind, Peak mode, Timeline points and Benchmark cases.
About This Scan
Below the results, About this scan has two panels:
- Measured performance: how the method has done on documented events, for example how many peaked on the right day and the chance rate, marked mostly in-sample. A note repeats how each day is sampled.
- Research scope: the scope, resolution, candidates, days, evaluated cells and returned results
Analysis Mode
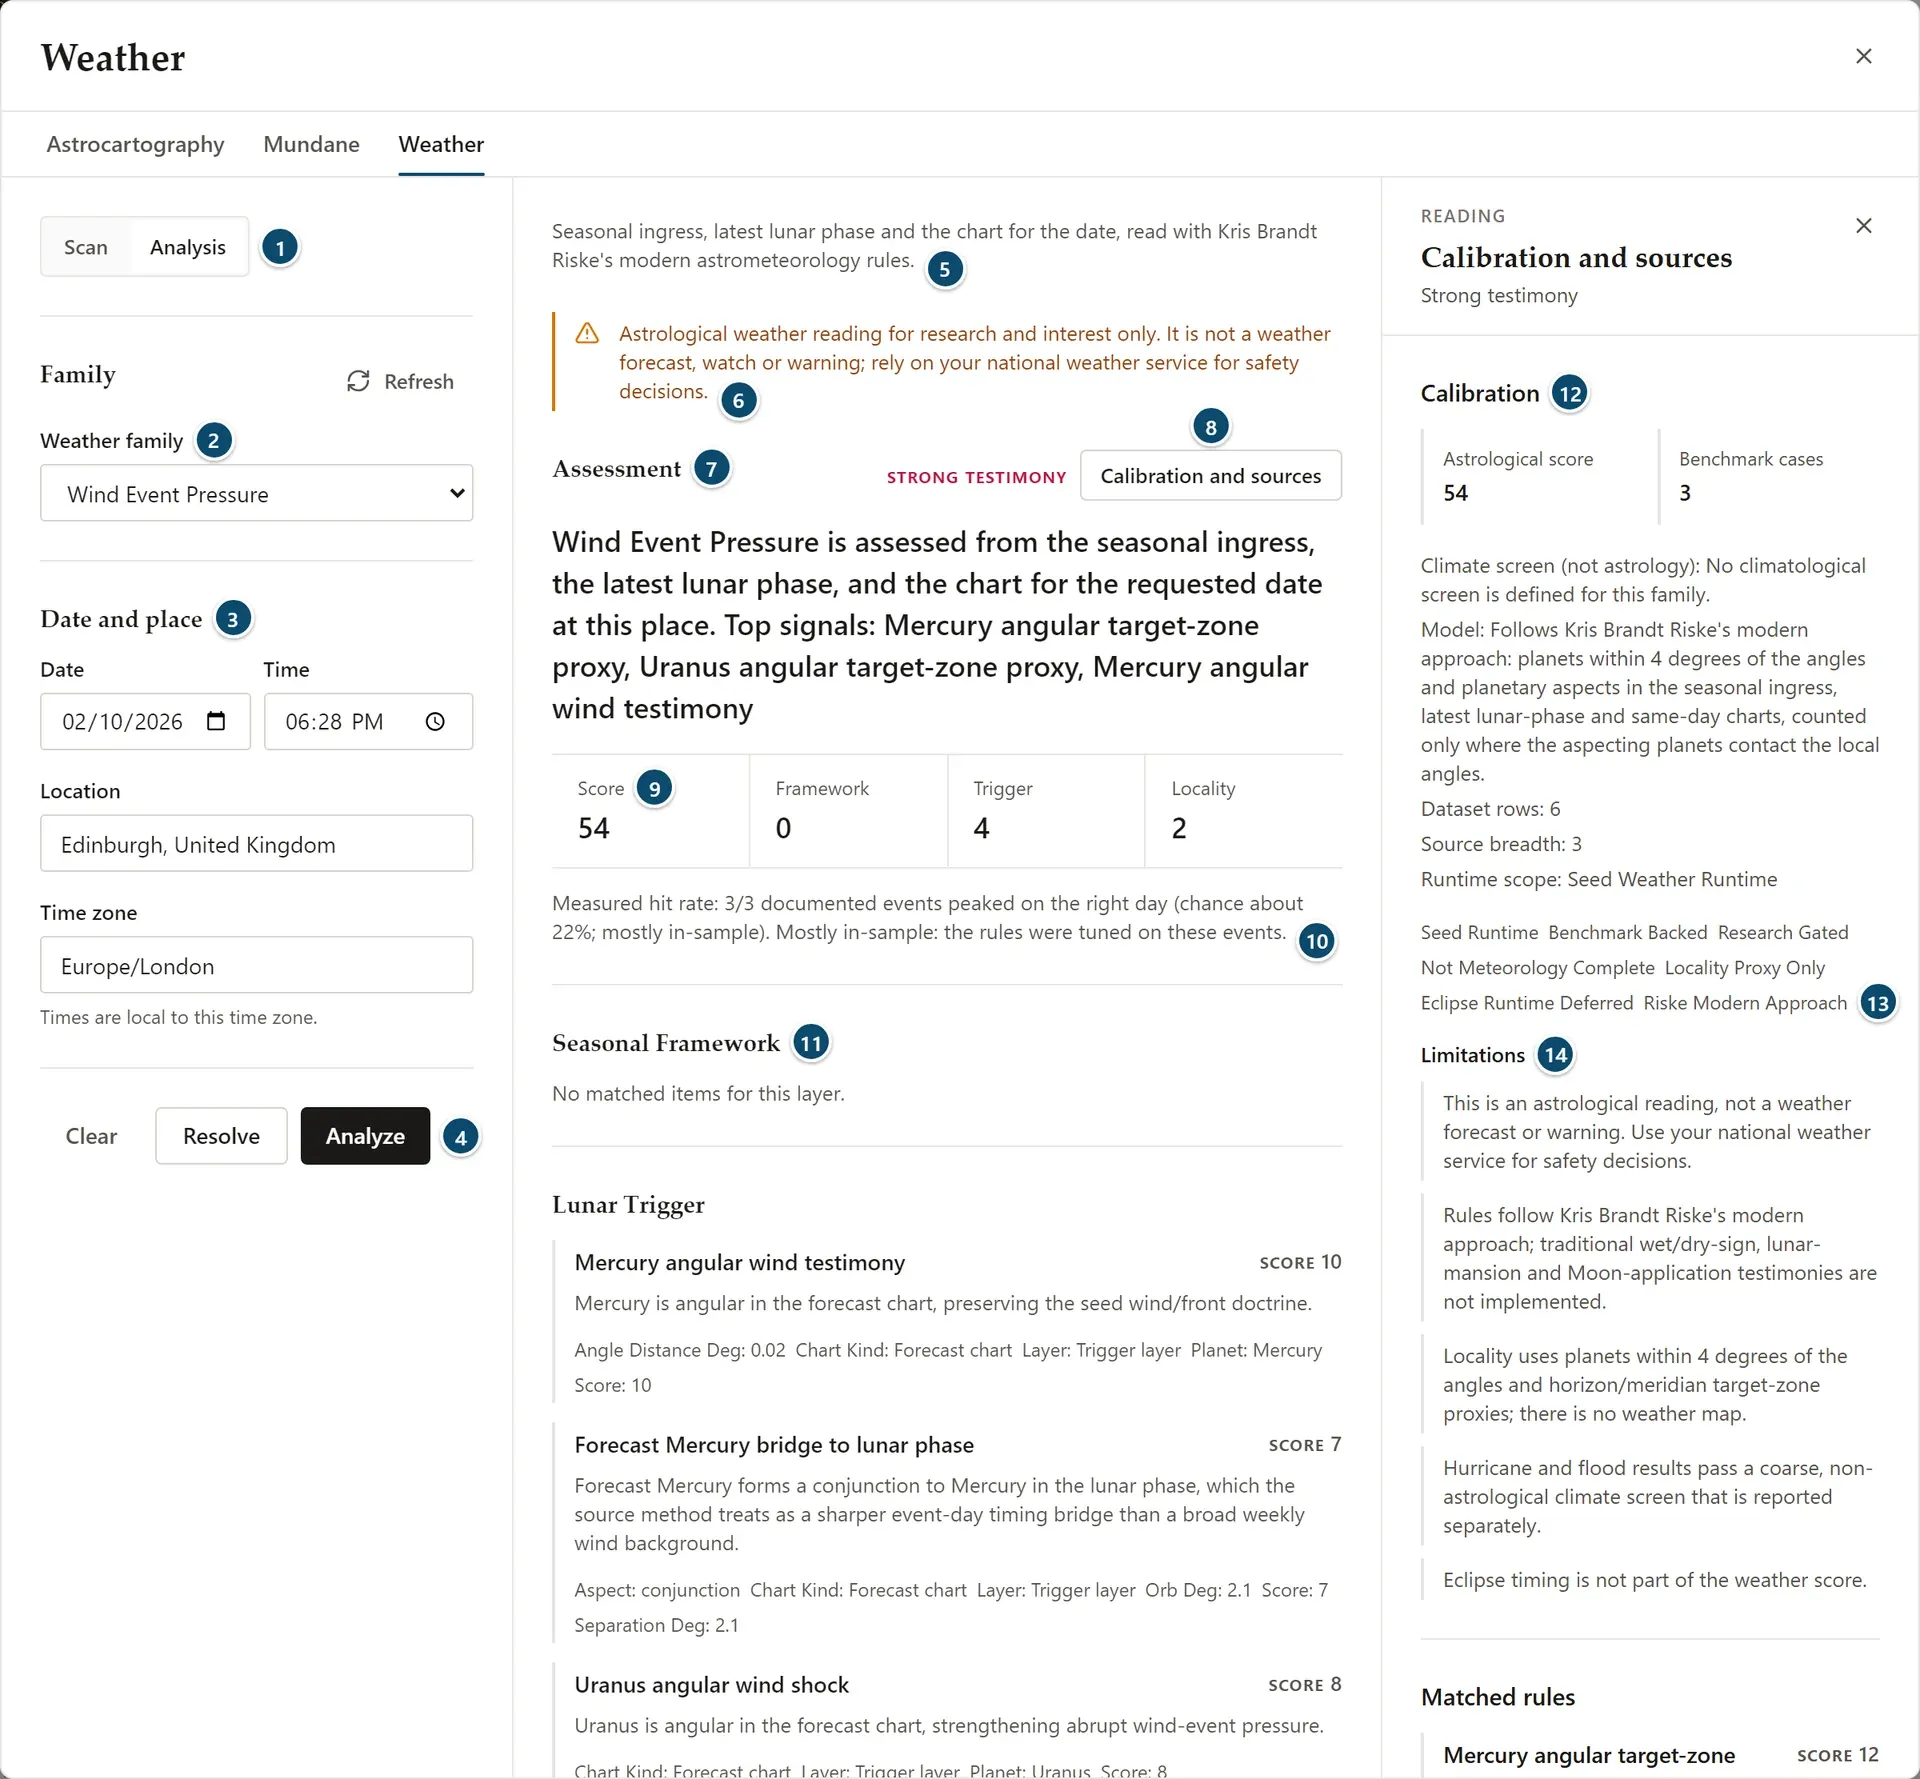
- Scan or Analysis
- Weather family
- Date and place
- Clear, Resolve and Analyze
- What the analysis reads
- The research notice
- Assessment, with its reading
- Calibration and sources
- Score, Framework, Trigger and Locality
- Measured hit rate
- Seasonal Framework, the first of the three layers
- Calibration
- Research flags
- Limitations
Analysis reads one moment at one place. Choose the Weather family, then under Date and place set the Date, Time, Location and Time zone; times are local to that time zone.
Resolve shows the chart context without a reading. Analyze adds the reading. Clear empties the date and place.
Above the results, the window says what it reads: the seasonal ingress, the latest lunar phase and the chart for the date, read with Kris Brandt Riske's modern astrometeorology rules. Then:
- Assessment: the reading, a summary with the top signals, the Score, and how many items matched in the Framework, Trigger and Locality layers
- Measured hit rate: for example, how many documented events peaked on the right day and the chance rate. When the rules were tuned on those events, the window says so (mostly in-sample).
- Seasonal Framework, Lunar Trigger and Locality Proxy: each matched item with its score and details, such as the planet, the chart it was found in and the orb in degrees, or "No matched items for this layer."
- The resolved context: the family, chart time, location and time zone, the chart for the date, the seasonal ingress and the latest lunar phase, with the research flags
Calibration And Sources
Click Calibration and sources to open them in the side inspector:
- Calibration: the Astrological score and Benchmark cases; the climate screen, which is not astrology; the model; dataset rows, source breadth and runtime scope; and research flags such as Research Gated, Not Meteorology Complete and Locality Proxy Only
- Limitations: what the reading leaves out
- Matched rules, Doctrine sources and Doctrine notes
Limitations spells out the method's limits. In the current app it says that:
- this is an astrological reading, not a weather forecast or warning; use your national weather service for safety decisions
- the rules follow Kris Brandt Riske's modern approach, and traditional wet/dry-sign, lunar-mansion and Moon-application testimonies are not implemented
- locality uses planets within 4 degrees of the angles and horizon/meridian target-zone proxies; there is no weather map
- hurricane and flood results pass a coarse, non-astrological climate screen that is reported separately
- eclipse timing is not part of the weather score
What Weather Can And Can't Tell You
- It reads charts by astrometeorology rules. It is not a weather forecast, watch or warning, and it isn't a guide to safety decisions: use your national weather service.
- Readings describe astrological testimony. A share of the top score only compares results within one scan.
- Measured hit rates come from a small number of documented events, and the window says when they are mostly in-sample.
- Locality is a proxy based on the chart's angles; there is no weather map.
Practical Workflow
- Open Weather from the Places group.
- Choose a weather family.
- Choose Specific place and enter a place, or choose Region and pick one.
- Set the time window, then click Run scan.
- Read the Matrix or Dates view, and select a place or date for the side inspector.
- Switch to Analysis to read one moment in full and check its calibration, sources and limitations.
Notes
- No saved chart is needed.
- Scan and Analysis have separate settings.
- A scan covers at most 31 days and 186 place-days.
- The reading is not a weather forecast, watch or warning.